The New Security Activity Report
What is the Security Activity Report?
The Security Activity report highlights security events generated by your organization's identities visiting destinations flagged—but not necessarily blocked—by Umbrella security researchers as a threat. This includes security events filtered through the Intelligent Proxy and File Inspection. (The File Inspection feature is currenly in limited availability.) The Security Activity report enables discoverability to threats by showing traffic pattern, which you can group by type to better see patterns and thus better protect your network.
Activities captured by this report might include attempts to access sites hosting malware or phishing sites, botnet activity on infected machines on your local network, attempts to download malicious files—or more. To find out about each of the individual activities and categories you can report on, click here.
Use the Security Activity report to see how you are currently being protected against threats and if there are any "holes" in your current protection. Is there a threat being posed against your system that you might be better protected against? Use the information available here to determine if security threats to your system have changed or if there are updates to your policies that you might need to make to protect yourself against threats that you are currently not protected against. You can easily determine what actions have occurred that have put your system at risk. You can see a destination that's been visited that's put you at risk. And with this information, you can make changes to Umbrella to protect yourself even more!
The Security Activity report's been upgraded! You can still access the old report by downgrading Umbrella. To access the old report's documentation, see Security Activity Report
Accessing the Security Activity Report
In Umbrella, navigate to Reporting > Security Activity.
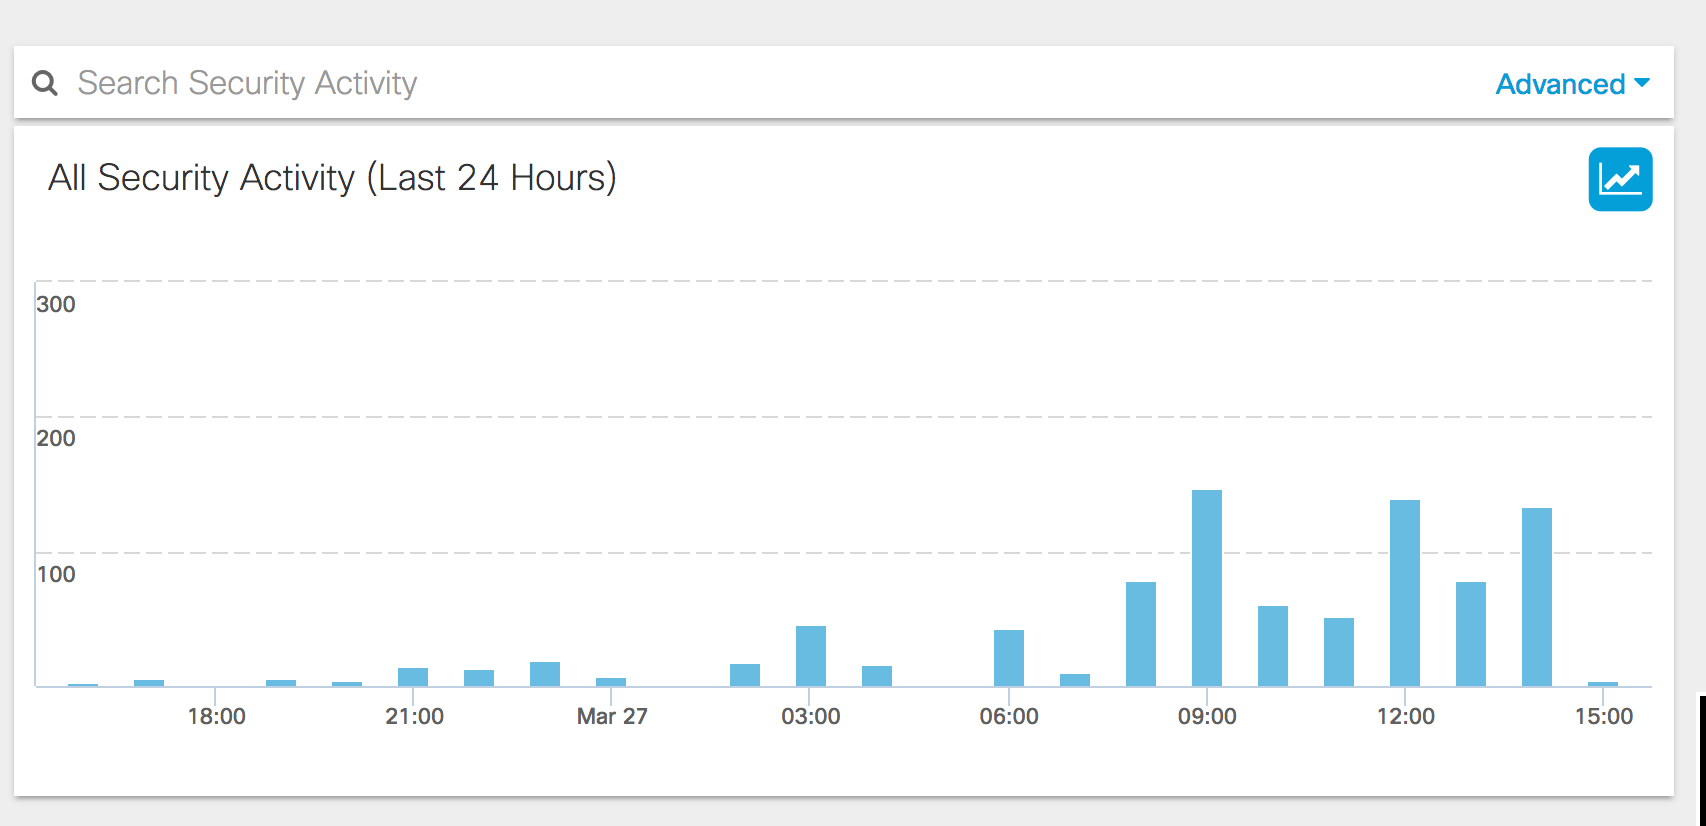
This takes you to the default view of the Security Activity report, which starts with a graph showing you all of the security events for your organization tracked over time.
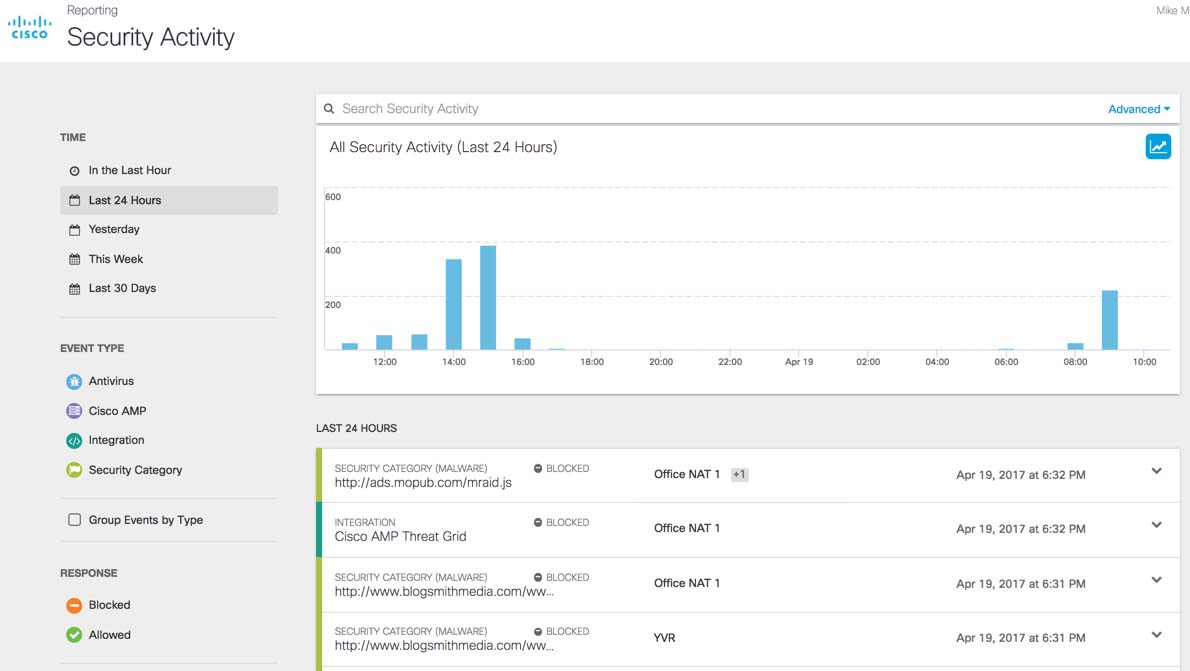
The graph shows any spikes or trends in your environment, possible outbreaks or—if you're lucky—times of relative calm. The y-axis is the number of events and the x-axis is the time period.
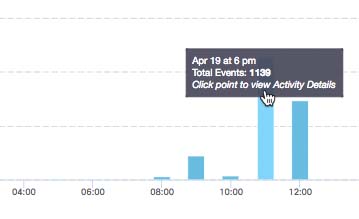
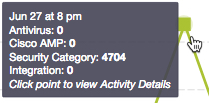
Hovering over a specific area in the summary report provides you with some high-level specifics for the selected time period.
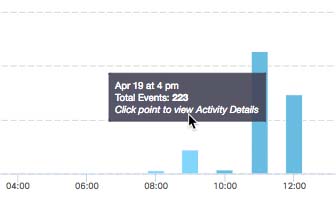
Clicking a bar in the graph takes you to the Activity Search report where you can view activity details for that time period.
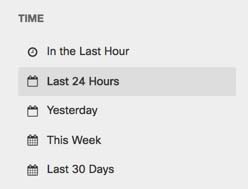
Like other Umbrella reports, the Security Activity report is time-based. You can generate a report to document activities for the last hour, the last 24 hours, the previous calendar day (yesterday), the last seven days, and the last month. At any given time, the upper limit to the time period with which you can generate a report is 30 days.
NOTE: You may notice a difference between the time listed in the pop-up window and that displayed along the x-axis of your charts. The chart uses "local" time to track when the data was logged. The pop-up using the time configured for your account (Settings > Accounts). In these examples, the local time is Pacific > Vancouver; whereas, the account time is set to UTC. To sync times, navigate to Settings > Accounts and change time to local time—the time when data is being logged.
At any time you can change the time period within which Umbrella tracks security activity. Under Time, select a new time period.
TIP
Most, if not all, Umbrella reports are highly time dependent. The time is UTC by default, but can be changed to a different timezone on a per-user basis. Navigate to Settings > Accounts and update your account's time setting.
Search for Security Activity
It's easy to search for the security activity of a specific identity you're interested in. Just enter the identity's name in the search bar at the top of the page and press Enter.
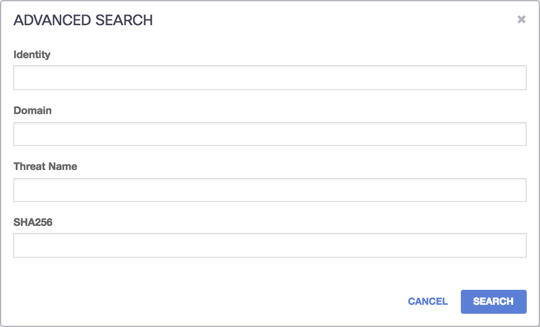
- Click Advanced, to perform a more detailed search.
- Enter the specifics of your search and then click Search. You don't have to enter information for each search field, but remember that the more information you can provide the more successful your search will be.
Threat Name is a name Umbrella security researchers have assigned to a piece of malware to identify a specific attack. For example, "Ransomware" or "Locky"—the first being a family of threats and the latter being a specific attack.
SHA256 is the file hash you are searching for.
Accessing Event Details
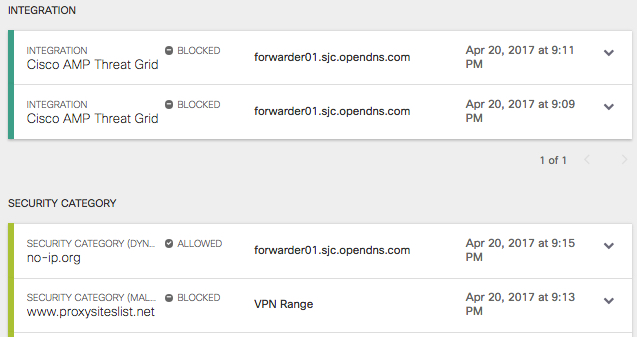
Under the Security Activity bar graph, you'll find "cards" that stack the details of security events by destination for the selected time period and filters. Aggregated over time, these cards show you all the identities that have visited a destination within the selected time period.
These cards stack data so that you are not overwhelmed by information and can focus on what is important to you.
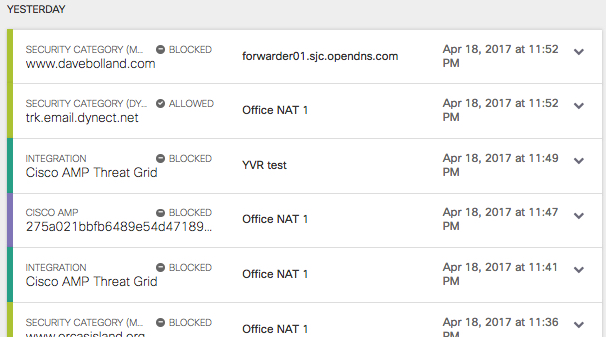
Click an event to view its details. Each security activity card groups an event by destination and lists the details of the event including date & time, destination, and identity. Details differ slightly between card type (Antivirus, Cisco AMP, Integration, and Security Category), but all list destination and identity from which you can click through to the Destinations and Identities reports.
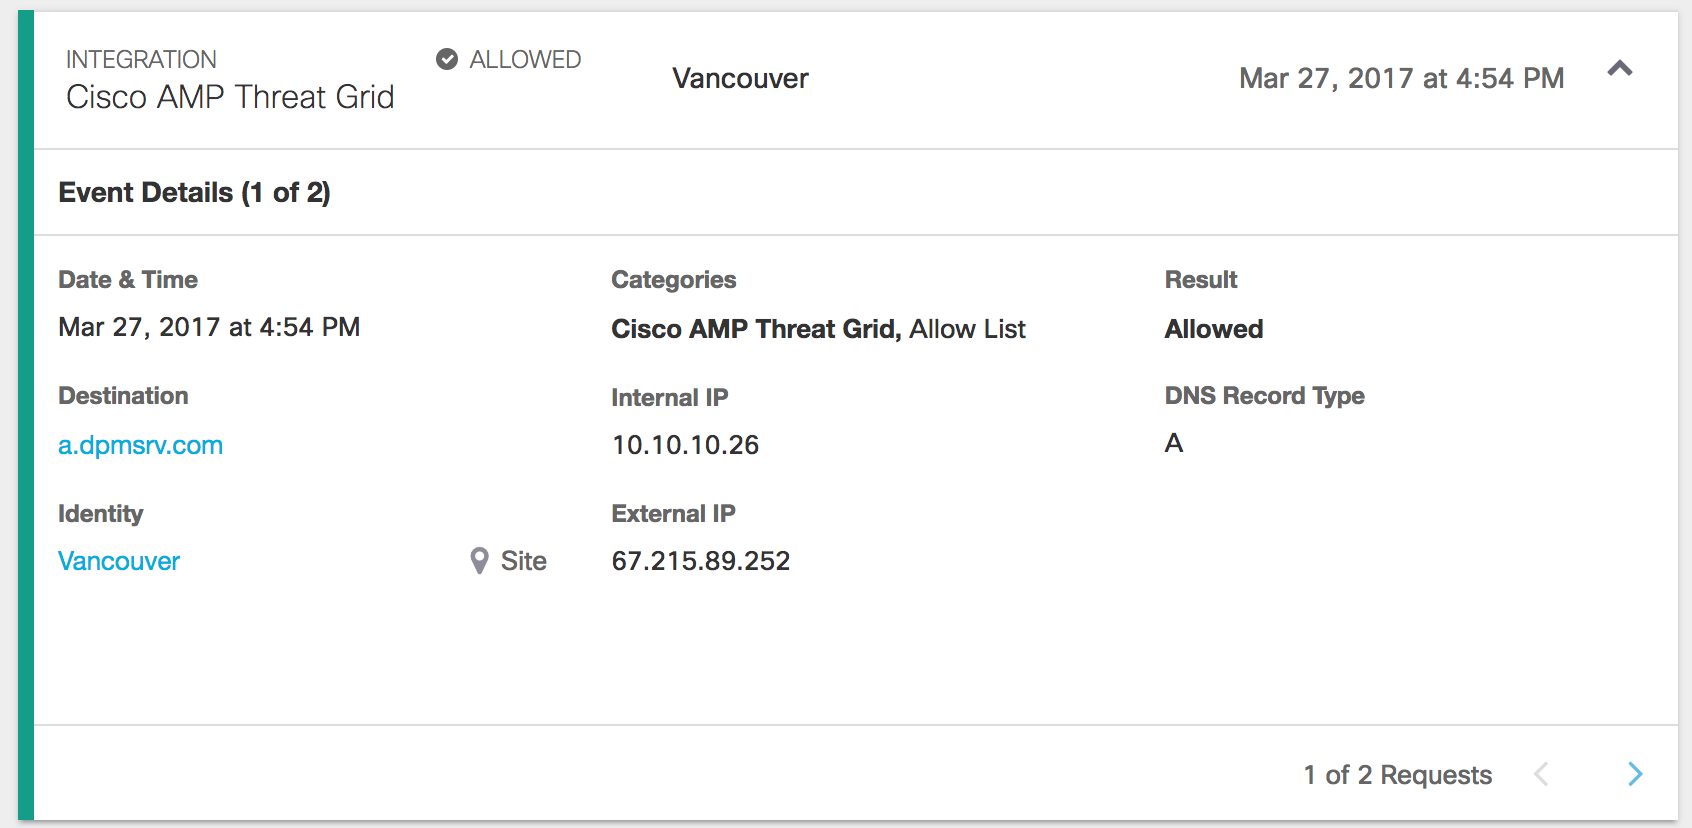
Because each card includes all requests for the destination, you can click through the 'cards" requests to see the details for each request including all the identities that triggered the event—requested a destination.
If a security event includes a +, it means that more than one identity is involved with this security event. You can click through the cards "stacked" requests and identify each identity.

Filtering Security Events
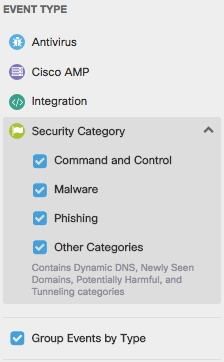
Security events listed are based on the following Event types:
- Antivirus—Lists events that the Intelligent Proxy has filtered through a virus scan
- Cisco AMP—Lists events that the Intelligent Proxy has run through Cisco Advanced Malware Protection (AMP)
- Integration—Lists events allowed or blocked based on destination lists generated from custom or third party data feed integrations
- Security Category—Lists events allowed or blocked against selected security categories: Command and Control, Malware, Phishing, and Other Categories (Contains Dynamic DNS, Newly Seen Domains, Potentially Harmful, and Tunneling categories).
If you clear all sub-Security Category entries and then select Security Category, all security category events are grouped as one event.
Antivirus and Cisco AMP are only available with Umbrella Insights or Platform packages, or for MSPs and customers of those MSPs. For more information on upgrading your package, please contact your Cisco Umbrella representative.
Those without either the Umbrella Insights or Platform packages have access to a reduced set of security events.
When you filter based on an Event type and check Group Events by Type, you'll notice that the graph changes from a bar to a line.
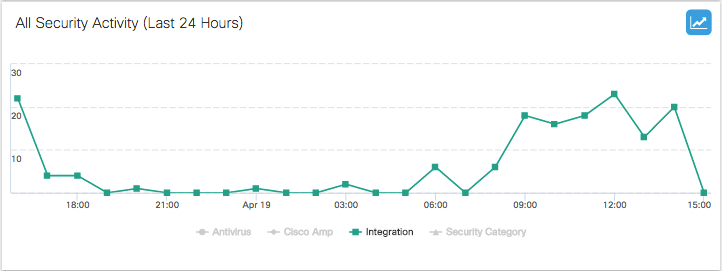
And security events are grouped together.
Rolling over the line graph pops up a modal giving you an overview of the security event at that time on the graph. Clicking the line graph takes you to the Activity Search report where you can view activity details in even greater detail.
With Group Events by Type checked and more than one Event Type selected, the activity chart updates to show each selected event so that you can compare activities. Your graph may redraw itself to accommodate differences in event totals.
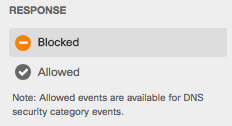
And you can filter based on the type of response, too:
- Blocked
- Allowed
Filter against Blocked to see what you are blocking and if there is anything you might not want to block.
Filter against Allowed to see what you could have blocked if you had enabled policies for those identities in block mode. Use this filter to determine the current strength of your policy and if you need to make changes.
If you select Antivirus or Cisco AMP as the Event Type, you cannot select Response > Allowed. Umbrella cannot allow viruses to pass through the system. These will always be blocked.